How B2B companies generate and maintain new business has changed dramatically over the past few months.
In the wake of the COVID-19 crisis, sales executives across every industry had to make quick and critical decisions to either pause on sales outreach or press forward with a new strategy. Now that reports have shown signs of recovery for core business metrics, it's clear that the strategic efforts made during the peak of the crisis are paying off now.
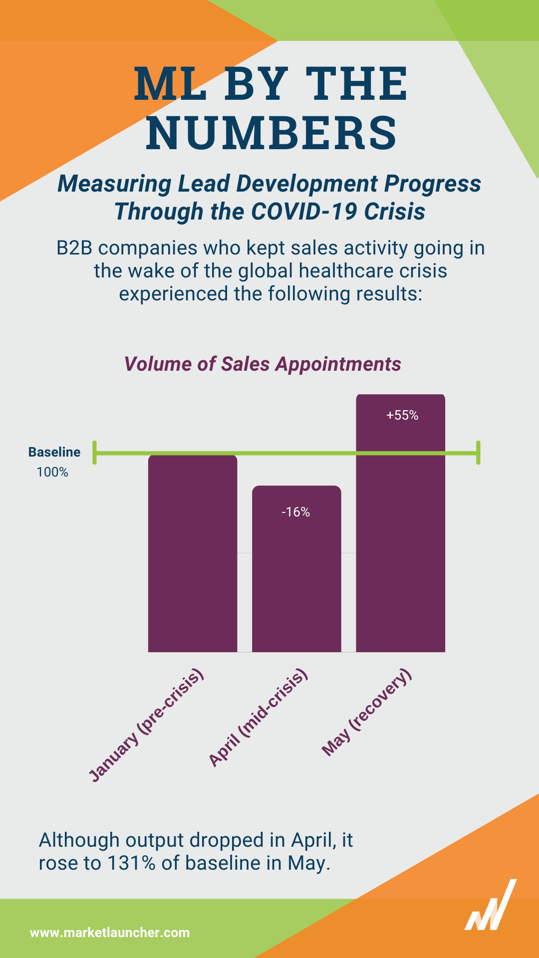
The MarketLauncher data team has aggregated the metrics on sales lead activity before the pandemic (January) and compared them to the peak of the crisis in April through to May, when we experienced an upswing towards recovery.
These numbers can serve as helpful benchmarks for you to measure your sales development progress and gauge how your buyers may be impacted over time.

The above graph shows overall results based on sales qualified leads generated across all ML accounts:
.png?width=538&name=ML%20by%20the%20Numbers%20(2).png)
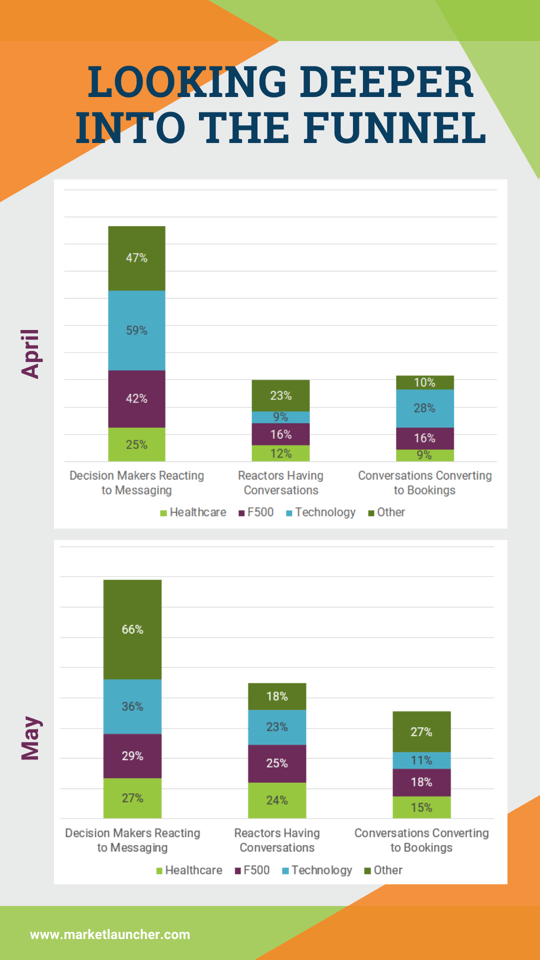
As one of the hardest hit industries, Healthcare's sales progress was heavily impacted in April but showed a significant recovery in May.
Sales activity aimed at the Fortune 500 experienced low overall conversion rates but saw an uptick in May as well.
While performance in Technology has stayed consistent, we have been able to reach more tech buyers in May vs. April, so conversations are up.

Buyers in Technology and Fortune 500 were more receptive to information mid-crisis as corporate executives began working from home. We saw spikes in reaction to email messaging and content, much of which we re-tooled to address specific crisis-related challenges.
In May, as executives settled into remote work, we saw increases in conversations in Fortune 500 and Technology.
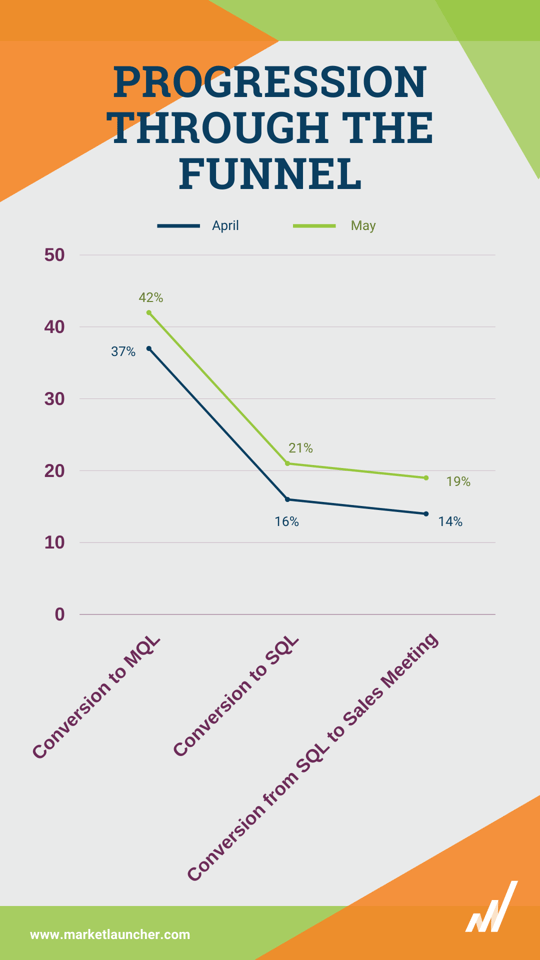
For the Healthcare sector, conversion to MQL was significantly lower than usual in April as health systems became overrun with patients and healthcare offices suffered a decline in revenue. However, in May we saw a major swing back towards normal sales activity in Healthcare as the rate of conversations doubled and the number of conversions to a booked meeting increased by 67%.
Interestingly, technology companies converted to booked appointments at the highest rate of all industries during April while we were mid-crisis. This changed in May, and although more conversations occurred, fewer moved forward to a booked meeting. It's too early to predict what caused this shift for technology buyers, but future reports will uncover how these buyers will be impacted in the long-run.

Looking at all industries combined, there has been an increase in conversion at multiple lead stages, showing signs of hope that sales activity is on its way towards normalcy.
If you kept sales activity going during the global crisis and made strategic adjustments to your outreach, you are in a much better position than if you stopped activity altogether -- even for just one month. The data has shown that those who paused their activity in the wake of the crisis now have a much bigger gap to fill and will take longer to recover revenue.
The pandemic is far from over and we expect to see fluctuating patterns throughout the year. The impact that the crisis has had on deals moving all the way through the sales pipeline to a closed deal remains to be seen. We will continue to track and report our findings as sales outreach develops into the year.
Download the full infographic.
If you are one of many companies who paused outreach during the crisis and are now looking for ways to recover your sales opportunities, we’ve created a 90-Day Map to Save Your Sales Pipeline that can help you get back on track.
Please contact us below for a walk-through of the 90-Day playbook.


